
7 Chapter 7 – Photosynthesis
Photosynthesis
BACKGROUND
is the process by which certain organisms convert the sun’s energy into chemical energy to use in the synthesis of glucose for food. Organisms that carry out photosynthesis to make their organic molecules are called autotrophic. Some examples of autotrophic organisms include plants, algae, and blue-green bacteria. In plants, photosynthesis occurs in chloroplasts in stacks of thylakoid membranes containing photosynthetic pigments. The primary photosynthetic pigment that absorbs light in plants is a green pigment called . Plants have wide varieties of pigments, absorbing different wavelengths of light. Chlorophyll a is the primary plant pigment and makes up about three-fourths of all plant pigments. It absorbs red and blue light. Chlorophyll b is another plant pigment. It absorbs blue-green and orange-red light. are accessory pigments that absorb blue and blue-green light. These pigments are fat-soluble and usually masked by chlorophyll a.
is another accessory pigment that absorbs bright red colors. There is also chlorophyll c and d that sometimes take the place of chlorophyll b.
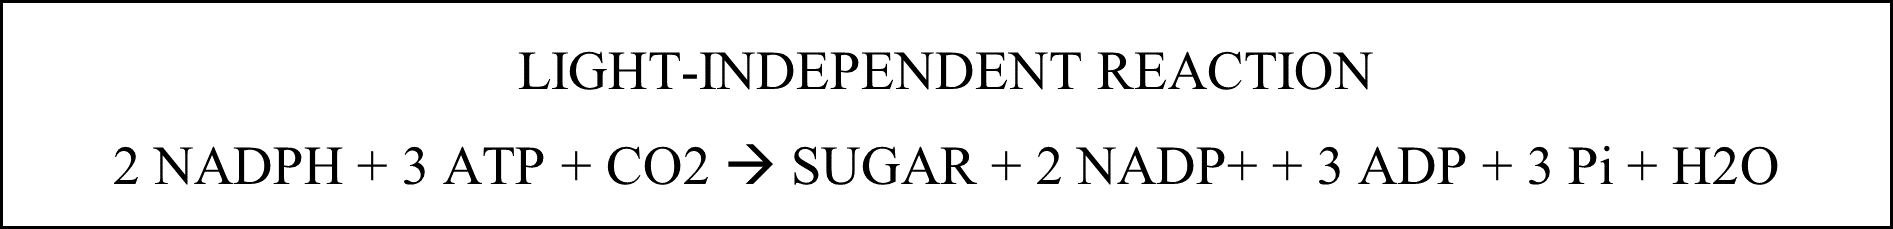
There are two main parts to photosynthesis: the and the . In the light-dependent reaction, pigments such as chlorophyll trap energy from light and use it to split water molecules (photolysis) into hydrogen ions, electrons, and oxygen. The light energy from photons causes electrons in the chlorophyll molecule to move to a higher energy state. This high-energy electron is then transferred to a primary acceptor molecule and passed down a chain of electron acceptors, releasing energy as it does so. The plant uses the released energy to pump hydrogen ions (released from the photolysis process) across the thylakoid membrane, creating an electrical gradient to make ATP. An electron created during photolysis replaces the electron lost from the chlorophyll. Two electrons and hydrogen from the split water molecule are transferred to the final acceptor molecule, reducing NADP+ to NADPH. The oxygen from photolysis is released into the atmosphere. One NADPH and two ATP molecules are produced for every two electrons entering the pathway. The ATP molecules are released into the stroma as protons diffuse down their gradient through the .

The light-independent reaction involves the fixing of carbon dioxide. As a result, glucose and fructose chains are made, and oxygen is released. This oxygen passes through the stomata of the plant. The ATP and NADPH produced by the light-dependent reaction are used to synthesize organic molecules, such as glucose, from carbon dioxide and water. The metabolic pathway called the Calvin cycle first produces ribulose bisphosphate (RuBP). Next, a carbon atom is attached, creating an unstable six-carbon molecule that splits into two phosphoglycerates (PGA). In the next step, phosphate is donated by ATP, and hydrogen plus NADPH donates electrons to form phosphoglyceraldehyde (PGAL). Two combine to create a six-carbon sugar phosphate, while the rest of the PGAL is recycled back to RuBP. This six-carbon sugar phosphate is the building block for glucose, sucrose, fructose, starch, or cellulose. These products are stored in the stroma before being transported to other parts of the plant. Finally, the oxidized ATP and NADPH (now ADP and NADH+) diffuse back into the grana to be used in the light-dependent reaction.

If the light-dependent reaction fails to produce the hydrogen, electrons, or energy required by the light-independent reaction, the plant will be unable to create its food or any other organic compounds it needs to survive. This experiment will allow you to observe the effect of the intensity of light on the photosynthetic rates of a chloroplast suspension. The process uses a chemical called as a stand-in for NADP+. DPIP is a blue compound capable of being oxidized and reduced. As a result, the DPIP loses color (becomes less blue) as it is reduced. The intensity of the blue color is measured by taking the absorbency using a spectrophotometer. A decrease in absorbance values indicates photosynthesis is taking place, correlating to the reduction of NADP+. The photosynthetic rate under different amounts and quality of light will be measured using this method.
Paper Chromatography and Rf values
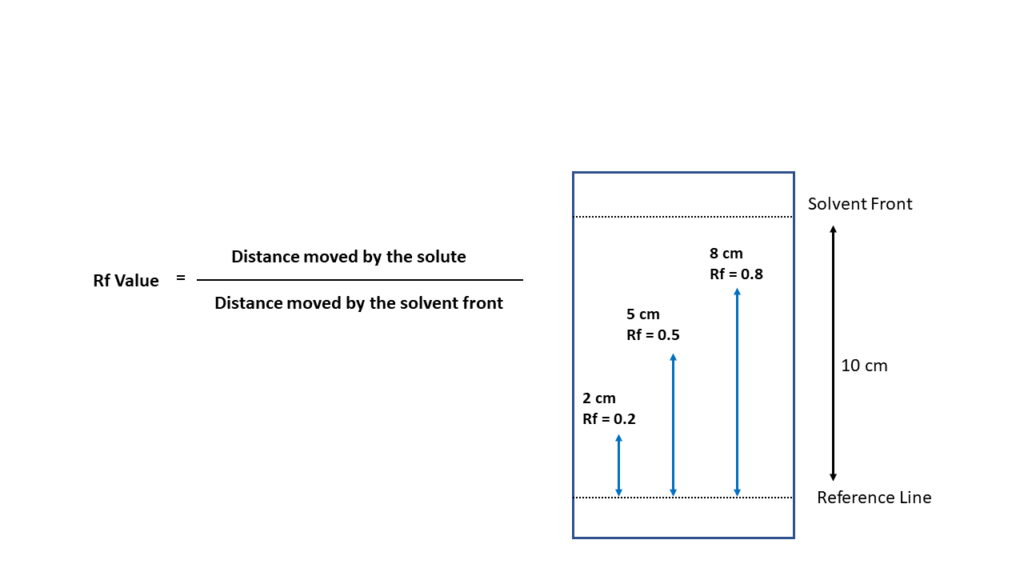
is a process used to separate mixtures such as plant pigments. A solution of pigments is applied to the paper strip, adsorbing to the paper fibers. When the paper tip is dipped in a solvent, the solvent moves up through the paper and dissolves the line of pigments. The different pigments have a different solubility in the solvent, so they move up the strip at different rates. Pigments that dissolve easily in the solvent will move further up the strip while the low solubility pigments stay toward the bottom of the strip, thus separating the pigments. Each pigment has a characteristic rate of movement which can be measured by comparing the distance moved by the pigment to the distance moved by the solvent.
The Rf value, or retention factor, is a ratio used to describe the distance a component in a mixture travels in relation to the distance the solvent travels. It is calculated by dividing the distance a component travels by the distance the solvent travels. For example, if the component travels 5 cm and the solvent travels 10 cm, the Rf value is 0.5
KEY for Rf values for Photosynthesis pigments
- β-carotene – 0.99
- chlorophyll a – 0.30
- chlorophyll b – 0.13
- violaxanthin – .40
- lutein – .68
Spectrophotometry
is a branch of electromagnetic spectroscopy concerned with the quantitative measurement of the reflection or transmission properties of a material as a function of wavelength. Spectrophotometry uses spectrophotometers, that can measure the intensity of a light beam at different wavelengths.
Absorption spectrophotometry is used to measure the: 1) concentration of a substance in solution, 2) properties of different types of molecules, and 3) biological activities of living cells, such as enzyme activities and rates of photosynthesis.
A spectrophotometer is an instrument that measures the amount of photons (the intensity of light) absorbed after it passes through sample solution. With the spectrophotometer, the amount of a known chemical concentrations can also be determined by measuring the intensity of light detected.
Learn the parts of the microscope (activity)
- Visit NC BioNetwork Spectrophotometer
- Click on “Explore”
- Click on “Launch Activity” to learn a general overview of spectrophotometry and operation of a spectrophotometer.
Key Terms
- Photosynthesis
- Light-independent reaction
- Light-dependent reaction
- Chlorophyll
- Rf value
- Chromatography
- Spectrophotometry
- ATP synthase complex
- DPIP
- Photolysis
Objectives
- Observe the effects of differing light intensity on the rate of photosynthesis.
- Use a spectrophotometer to measure absorbance and determine the rate of photosynthesis under these different conditions.
- Separate plant pigments using paper chromatography and determine the Rf value of the different pigments.
Preassessment
- Why is energy required for life?
- How does energy enter the living world?
- What composes visible white light?
- What is the name of the green pigment that captures light for photosynthesis?
- Which part of the plant does photosynthesis occur?
- What is the starting source of the carbon in the glucose produced by photosynthesis?
- Where does the ‘light’ or light-dependent reactions occur?
- Where does the light-independent reactions occur?
- Why is water necessary for photosynthesis?
- Why is chlorophyll perceived as being green?
Exercise 1: Paper Chromatography
Materials
- Pigment solvent (on ice)
- Chromatography paper
- Chromatography Chamber (red stopper)
- p-1000 Micropipette and tips
- Rulers
- Pencil
PROCEDURE
Obtain a strip of chromatography paper and a chromatography chamber with red stopper. Be sure to only handle the paper by the edges. Cut the paper to fit the tube if necessary.
With a pencil, make a faint line across the chromatography paper about one inch from one end. This is your origin line.
Place a fresh leaf, underside down, on the origin line of the chromatography paper. Using a pencil eraser, rub the leaf to leave a line of pigment on the paper. Rub firmly to make an even line all the way across the origin line.
Pour pigment solvent into the bottom of the chromatography chamber to about ½ inch. Stand the strip of paper in the chamber with the origin line and pigment just above the level of solvent. The bottom of the paper should be touching the solvent.
Let the chromatography chamber sit until the solvent reaches ½ inch from the top of the paper. Remove the paper strip from the chamber and mark the line of the solvent front with a pencil.
Allow the strip to dry, then observe the bands of color on the paper. Draw your results in your lab notebook.
Calculate the Rf value for each pigment:
Measure the distance from the pigment origin to the solvent front.
Measure the distance from the origin to each pigment band.
Divide the distance traveled by each pigment by the distance traveled by the solvent.
Record the calculated Rf value in Table 1.
| Pigment | Description of color | Distance Solvent Front Traveled | Distance Color Traveled |
Rf value | Name of Pigment (Use the Key) |
|---|---|---|---|---|---|
Exercise 2: SPECTROPHOTOMETRY
Materials
- DPIP solution (on ice)
- Chloroplast suspension (on ice)
- Spectrophotometer
- Cuvettes (3)
- p-1000 Micropipette and tips
- Grow light
- Small beaker
- Aluminum foil
- Wax pencil ir Marker
PROCEDURE
Label one cuvette ‘D’ for dark reaction. Label a second cuvette ‘L’ for light reaction. Only write at the very top of the cuvettes.
Add 3ml of DPIP and 150µl of chloroplast suspension to each cuvette. Gently mix without creating air bubbles.
Set the spectrophotometer to a wavelength of 600nm and blank the instrument
Use the up/down arrows or turn the dial on the instrument to change the wavelength until it reads 600nm.
Set the spectrophotometer to absorbance mode by pressing the A/T/C button until absorbance is displayed.
Add 3ml of deionized water to a clean and dry cuvette and insert it into the holder in the sample compartment.
Press the 0 ABS/100%T button to blank the instrument. Remove the cuvette.
Take an initial absorbance reading at time ‘0’ for the D and L cuvettes:
Wipe the cuvette with lens paper to remove any fingerprints or liquid.
Place the cuvette into the sample compartment so that the light is able to pass through the clear sides of the cuvette.
Read and record the absorbance given by the spectrophotometer.
For the dark reaction cuvette (D), wrap the cuvette in aluminum foil. Wrap it tightly to prevent light getting into the cuvette. Let the wrapped cuvette sit for 5 minutes.
Place the light reaction cuvette (L) in a small beaker of water to protect the solution from heat; place it under grow lights for 5 minutes.
After the five minutes, take an absorbance reading for each cuvette using the spectrophotometer. Be sure to remove the aluminum foil from the dark reaction cuvette before placing it in the sample compartment.
Return the cuvettes to their conditions and continue to take absorbance readings every 5 minutes for 25 minutes. Record the data in Table 2.
| Time (mins) | Light reaction | Dark Reaction |
|---|---|---|
| 0 | ||
| 5 | ||
| 10 | ||
| 15 | ||
| 20 | ||
| 25 |
DATA Analysis
- Plot a graph of absorbency over time for both the light reaction and the dark reaction. Use the y-axis for absorbency and the x-axis for time.
- Why are plants generally green?
- What is a benefit of the pigments in photosynthesis?
- What is the significance of the Rf values?
- Why is wavelength information important in studying plants?
- In which colors of light would you expect a plant to obtain maximum
photosynthetic activity? - Considering the results of the experiment 2, what conclusions can you make about the requirements of photosynthesis?
- The spinach leaf looks green, but the chromatogram demonstrated that other pigments are also in the leaf. Would you expect a plant to grow well in only green light? Explain.
- Why can you not readily see the other pigments in the leaf?
- Would you expect a plant to grow well in only green light? Explain.
Supplemental
- All data tables from this lab
- Include any images and notes from your bench. If errors occurred, explain why you think they happened and what did you do (or what would you do in a future attempt) to rectify the issue.
- Include your group members’ names – assign a % (out of 100) that you believe each deserves, based on their input during the lab. Justify your answer.
Licenses and Attributions
Biology I Cellular Processes Laboratory Manual by The authors & Hillsborough Community College is licensed under a Creative Commons Attribution-NonCommercial 4.0 International License.
The process by which green plants and some other organisms use sunlight to synthesize foods from carbon dioxide and water. Photosynthesis in plants generally involves the green pigment chlorophyll and generates oxygen as a byproduct.
Chlorophylls absorb light most strongly in the blue portion of the electromagnetic spectrum as well as the red portion. The molecules of chlorophyll are large (C55H70MgN4O6). Several chlorophylls are known. All are defined as derivatives of the parent chlorin by the presence of a fifth, ketone-containing ring beyond the four pyrrole-like rings.
Chlorophyll a - This pigment is found in all higher plants. It is the vital pigment in photosynthesis. It is found in algae, cyanobacteria and anaerobic phototrophs. It absorbs violet-blue as well as orange-red light and reflects blue-green light.
Chlorophyll b - This type of chlorophyll is seen in green algae and plants. It is an accessory pigment that aids chlorophyll a. This pigment usually absorbs the orange-red light and reflects a yellow-green color.
Chlorophyll c - This pigment is primarily seen in marine algae. It is an unusual chlorophyll pigment that has a porphyrin ring. This can be further classified into chlorophyll c1, c2 and c3. The chemical composition and the absorption rate differ in each sub-type.
Chlorophyll d - Chlorophyll d is present only in red algae and cyanobacteria. These organisms live in deep water, and thus use red light for photosynthesis.
Chlorophyll e - This is a rare pigment that has been identified from the yellow-green algae.
Chlorophyll f - This pigment was recently found and is known to absorb infrared light. Their function is unknown.
Carotenoids are accessory pigments that are typically yellow, red and orange. hey occur in chloroplasts where they aid in the light absorption for photosynthesis. There are various carotenoids and they are grouped into xanthophylls and carotenes. They interact with chlorophylls inside chloroplasts when they absorb light primarily for photosynthesis and protection from photodamage.
Anthocyanins belong to a parent class of molecules called flavonoids synthesized via the phenylpropanoid pathway. They occur in all tissues of higher plants, including leaves, stems, roots, flowers, and fruits. Anthocyanins are derived from anthocyanidins by adding sugars. The reds, purples, and their blended combinations responsible for autumn foliage are derived from anthocyanins. Unlike carotenoids, anthocyanins are not present in the leaf throughout the growing season, but are produced actively, toward the end of summer
Light-dependent reaction is the series of biochemical reactions in photosynthesis requiring light energy that is captured by light-absorbing pigments (such as chlorophyll) to be converted into chemical energy (ATP and NADPH). The light-dependent reaction takes place on the thylakoid membranes of the chloroplast.
The Calvin cycle, or light-independent reaction of photosynthesis, happens in the stroma of the chloroplast. It has certain enzymes that work with NADPH and ATP. They form carbon-containing molecules (such as glucose molecules) from carbon dioxide.
ATP synthase is a protein that catalyzes the formation of the energy storage molecule ATP using ADP and inorganic phosphate (Pi). ATP synthase lies across a cellular membrane and forms an aperture that protons can cross from areas of high concentration to areas of low concentration, imparting energy for the synthesis of ATP.
2,6-dichlorophenol-indophenol (DPIP) is a chemical compound used as a redox dye to measure the rate of photosynthesis. When oxidized, DPIP is blue with a maximal absorption at 600 nm; when reduced, DPIP is colorless. When exposed to light in a photosynthetic system, the dye is decolorised by chemical reduction. DPIP has a higher affinity for electrons than ferredoxin and the photosynthetic electron transport chain can reduce DPIP as a substitute for NADP+(the final electron carrier in photosynthesis). As DPIP is reduced and becomes colorless, the resultant increase in light transmittance can be measured using a spectrophotometer.
Chromatography is a process for separating components of a mixture. The mixture is dissolved in the mobile phase, which carries it through a second substance called the stationary phase.
Spectrophotometry is one of the most valuable quantitative analysis methods in various fields, such as chemistry, physics, and biochemistry. Spectrophotometry is a method to measure how much a chemical substance absorbs light by measuring the intensity of light as a beam of light passes through a sample solution. The basic principle is that a compound absorbs or transmits light over a specific wavelength range. This measurement is used to measure the amount of a known chemical substance.
