
10 Chapter 10 – DNA Gel Electrophoresis
DNA Gel Electrophoresis
BACKGROUND
When first introduced, DNA fingerprinting (DNA profile analysis or DNA typing) involved the electrophoretic analysis of DNA fragment sizes generated by restriction enzymes. In contrast to more conventional methodologies, such as blood typing, which excludes suspects, traditional DNA fingerprinting provides accurate, unambiguous identification of the source of DNA samples. Variations in DNA sequences between individuals, as determined by differences in restriction enzyme cleavage patterns, are known as . RFLPs are a manifestation of the unique molecular genetic profile, or “fingerprint,” of an individual’s DNA.
are endonucleases that catalyze the cleavage of phosphate bonds. They require Mg2+ for activity and generate a 5 prime (5′) phosphate and a 3 prime (3′) hydroxyl group at the cleavage point. The distinguishing feature of restriction enzymes compared to other endonucleases is that they only cut at specific sequences of bases.
Many different species of bacteria produce restriction enzymes, including cyanobacteria (blue-green algae). Over 3,000 restriction enzymes have been discovered and cataloged.
A requires a specific double-stranded recognition sequence of nucleotide bases to cut DNA. Recognition sites are generally 4 to 8 base pairs in length, and cleavage occurs within or near that site.
Recognition sites are frequently symmetrical, i.e., both DNA strands in the site have the same base sequence when read 5′ to 3′. Such sequences are called .
are easily cast and handled compared to other matrices because the gel setting is a physical rather than chemical change. Samples can also be recovered (removed) from the gel and used in downstream applications.
The technique separates DNA fragments ranging from 50 base pair to several megabases (millions of bases). The distance between DNA bands of a given length is determined by the percent agarose in the gel.
Most agarose gels are made with between 0.7% (good separation or resolution of large 5–10kb DNA fragments) and 2% agarose (good resolution for small 0.2–1kb fragments) dissolved in electrophoresis buffer. For most applications or analyses of unknown DNA sizes, a 1% gel is effective.
The DNA is always added to the electrically Negative (black) side of the electric current. DNA’s natural negative charge allows it to be pulled through the gel toward the positive (red) end. Remember, DNA “RUNS TO RED.”
The agarose gel acts as a molecular sieve in that larger pieces of DNA migrate more slowly than smaller pieces. Thus, after the technique, larger fragments of DNA are closer to the wells from which they originated, and smaller fragments travel further into the gel.
A (a DNA ladder or Molecular Weight Marker) is commonly run in a well adjacent to the analyzed samples to make the migration distances more informative. Size markers contain DNA fragments with known DNA sizes. So if your band migrates the same distance as one of the bands from the size marker, it’s safe to say it is approximately the same size.
How the DNA migrates in the gel depends on the DNA fragment’s size and the DNA strand’s orientation. Double-stranded DNA fragments behave like long rods, so their migration through the gel is relative to their size. Circular DNA, such as plasmids, may show multiple bands or even a smear because the migration speed may depend on whether it is relaxed or supercoiled. Supercoiling is a molecular conformation in which circular DNA is wrapped and tightly coiled around itself, thus taking up less space than a relaxed piece of DNA.
Additional Resources for Gel Electroresis
- Univeristy of Utah virtual lab
- Cold Spring Harbor Laboratory DNA Learning Center
- NC BioNetwork Virtual Microscope
Key Terms
Type your key terms here.
- DNA
- Restriction Enzymes
- Palindrome
- Agarose Gel
- RFLPs
- Buffers
- Fragment length
- Electrophoresis
Learning Objectives
- Perform Restriction Enzymes digestion of DNA samples.
- Demonstrate agarose gel electrophresis to separate the DNA fragments.
- Calculate the relative mobility (Rf) of each DNA fragment in the standard to determine the fragment length for your unknown samples.
Materials
Exercise 1: Restriction Enzyme Digestion of DNA samples
- Pipet tips
- EcoRI/PstI enzyme mix (ENZ) 1 tube (80 µl)
- P-10 or P-20 micropipette
- Color coded microtubes: green, blue, orange, violet, red, yellow or mark the microtubes as required.
- Lab marker
- Waste container
- Styrofoam microtube rack
- Ice bucket with ice
- DNA Samples
- Crime Scene DNA 1 vial (CS)
- Suspect 1 DNA 1 vial (S-1)
- Suspect 2 DNA 1 vial (S-2)
- Suspect 3 DNA 1 vial (S-3)
- Suspect 4 DNA 1 vial (S-4)
- Suspect 5 DNA 1 vial (S-5)
- Incubator or bath (37 °C)
Pre-Assessment
- What are the four pairs of DNA bases that form in the double helix?
- When performing recombinant DNA techniques, it is often necessary to cut desired DNA sequences with restriction enzymes. Where are these enzymes typically isolated from?
- How many strands make up a DNA double helix?
- What does a restriction enzyme recognize on the target DNA molecule?
- What is an agarose?
-
What is the relationship between the size of DNA and the rate of DNA migration on the gel?
-
What electrode (positive or negative?) will DNA molecules migrate to in an electric field? Explain.
-
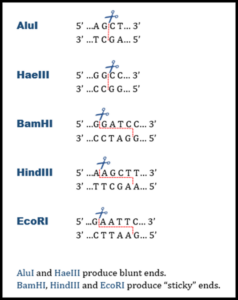
Two common restriction endonucleases are EcoRI and PstI which will be provided to you in this lab procedure. To better understand how EcoRI and PstI may help you in performing your DNA fingerprinting test, first you must understand and visualize the nature of the “cutting” effect of a restriction endonuclease on DNA

The line through the base pairs represents the sites where bonds will break if a restriction endonuclease recognizes the site GAATTC. The following analysis questions refer to how a piece of DNA would be affected if a restriction endonuclease were to “cut” the DNA molecule in the manner shown above.
-
- How many pieces of DNA would result from this cut? ___________
- Write the base sequence of both the left and right side DNA fragments
- LEFT – ______________________
- RIGHT – _____________________
- Consider the two samples of DNA shown below (single strands are shown for simplicity).
Sample 1 – 5′ C T C G T G A T C T C G A A T T C G C T A G T A A C G T 3′
Sample 2 – 5′ T C A T G A A T T C C T G G A A T T C G C A A A T G C A 3′
If both samples are treated with a restriction enzyme [recognition sequence GAATTC] then indicate the number of fragments and the size of each fragment from each sample of DNA.
-
- Sample 1 __________
- Sample 2__________
- List fragment size in order: largest ——> smallest
- Sample 1 __________
- Sample 2__________
- Name three other restriction enzymes and determine the sequence for the cutting of the DNA.
Exercise 1: Restriction Enzyme Digestion of DNA Samples ( Part 1)
Two common restriction endonucleases EcoRI and PstI are provided to you in this lab procedure. To better understand how EcoRI and PstI may help you in performing your DNA fingerprinting test, first understand the “cutting” effect of a restriction endonuclease on DNA.
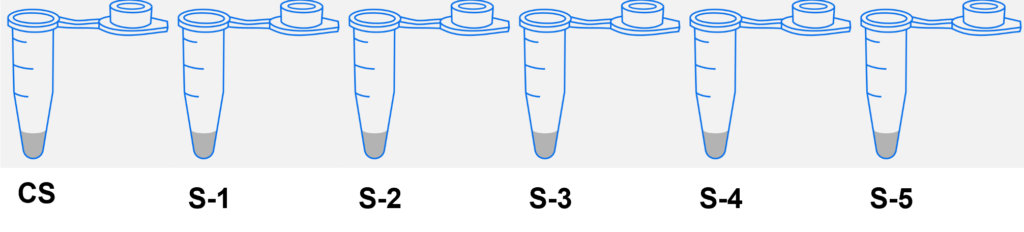
- Label the 5 microtubes as follows:
- Crime Scene DNA 1 vial (CS)
- Suspect 1 DNA 1 vial (S-1)
- Suspect 2 DNA 1 vial (S-2)
- Suspect 3 DNA 1 vial (S-3)
- Suspect 4 DNA 1 vial (S-4)
- Suspect 5 DNA 1 vial (S-5)
- Place the tubes in the rack.
- The restriction digests will take place in these tubes.
- Locate the clear microtube that contains the restriction enzyme mix and label it “ENZ” (ENZ = Enzyme mix).
- Obtain the DNA samples from your instructor. Using a fresh tip for each sample, transfer 10 µl of each DNA sample from the stock tubes into each of the corresponding labeled tubes (S-1 thru S-5).
| DNA Samples | EcoRI/PstI | Total Reaction Volume |
|---|---|---|
| Crime Scene (CS) – 10 uL | 10 uL | 20 uL |
| Suspect 1 (S-1) – 10uL | 10 uL | 20 uL |
| Suspect 1 (S-2) – 10uL | 10 uL | 20 uL |
| Suspect 1 (S-3) – 10uL | 10 uL | 20 uL |
| Suspect 1 (S-4) – 10uL | 10 uL | 20 uL |
| Suspect 1 (S-5) – 10uL | 10 uL | 20 uL |
- Close the caps on all the tubes. Mix the components by gently flicking the tubes with your finger. In the microcentrifuge, pulse the tubes for two seconds to force the liquid into the bottom of the tube to mix and combine reactants. (Be sure the tubes are BALANCED in the microcentrifuge). If your lab is not equipped with a centrifuge, briskly shake the tube or tap the tubes on the lab bench to combine and mix the contents.
- Incubate the samples by placing the tubes in the floating rack and incubate them at 37 °C for 45 minutes. (Alternatively, the tubes can be incubated in a large volume of water heated to 37 °C and allowed to slowly reach room temperature overnight).
- After the incubation, store the DNA digests in the refrigerator until the next lab period.
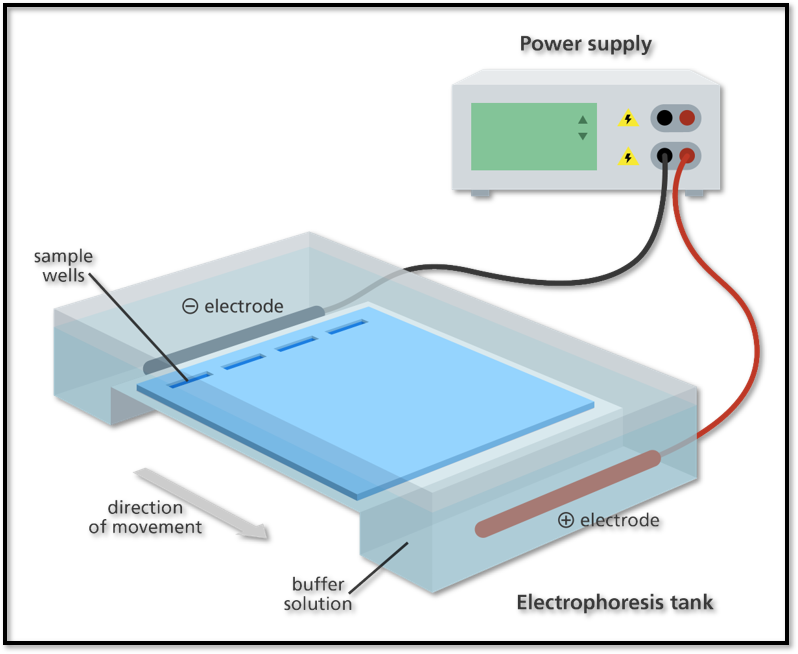
Exercise 2: Agarose Gel Electrophoresis
Electrophoresis separates DNA fragments according to their relative size. DNA fragments are loaded into an agarose gel slab, which is placed into a chamber filled with a conductive liquid buffer solution. A direct current is passed between wire electrodes at each end the chamber. DNA fragments are negatively charged, and when placed in an electric field will be drawn toward the positive pole. The matrix of the agarose gel acts as a molecular sieve through which smaller DNA fragments can move more easily than larger ones. Over a period of time smaller fragments will travel farther than larger ones. Fragments of the same size stay together and migrate in single “bands” of DNA.
- Obtain a prepoured agarose gel from your instructor, or if your teacher instructs you to do so, prepare your own gel. The gels would be 0.8% or 1.2% agarose gel.
- After preparing the gel, remove your digested samples from the refrigerator.
- Using a new tip for each sample, add 5 µl of sample loading dye “LD” to each tube.
- Close the caps on all the tubes. If a centrifuge is available, pulse spin the tubes to bring the contents to the bottom of the tube. Otherwise, tap the tubes upon a table top.
- Place the casting tray with the solidified gel in it, into the platform in the gel box. The wells should be at the (-) cathode end of the box, where the black lead is connected.
- Very carefully, remove the comb from the gel by pulling it straight up.
- Pour ~ 275 ml of electrophoresis buffer into the electrophoresis chamber, until it just covers the wells.
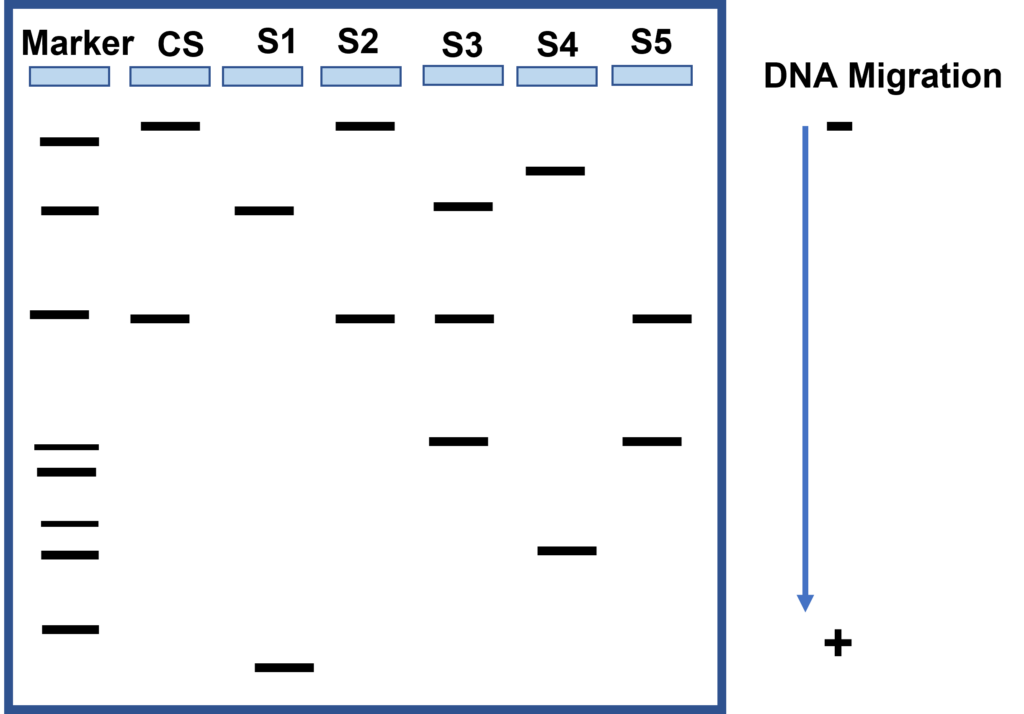
- Locate your lambda HindIII DNA size marker in the tube labeled “M”.
The first sample is loaded in the well at the left hand corner of the gel. (Gels are read from left to right). A DNA marker with fragments of known lengths is usually run through the gel at the same time as the samples. - Using a separate pipette tip for each sample, load your gel as follows:
- Lane 1: HindIII DNA size marker, clear, 10 µl
- Lane 2: CS, green, 20 µl
- Lane 3: S1, blue, 20 µl
- Lane 4: S2, orange, 20 µl
- Lane 5: S3, violet, 20 µl
- Lane 6: S4, red, 20 µl
- Lane 7: S5, yellow, 20 µl
- Secure the lid on the gel box. The lid will attach to the base in only one orientation: red to red and black to black. Connect electrical leads to the power supply.
- Turn on the power supply. Set it for 100 V and electrophorese the samples for 30–40 minutes.
- Shorter lengths of DNA move faster than longer lengths.
- The distance the DNA has migrated in the gel can be judged visually by monitoring the migration of the loading buffer dye.
- The electrical current is left on long enough to ensure that the DNA fragments move far enough across the gel to separate them, but not so long that they run off the end of the gel.
- Once the DNA has migrated far enough across the gel, the electrical current is switched off and the gel is removed from the electrophoresis tank.
- When the electrophoresis is complete, turn off the power and remove the lid from the gel box. Carefully remove the gel tray and the gel from the gel box. Nudge the gel off the gel tray and carefully slide it into your plastic staining tray (Note that the gel is very slippery).
- Pour 60 ml of Bio-Safe DNA stain into your plastic staining tray, cover with plastic wrap, and let the gel stain overnight, shaking intermittently if no rocking platform is available.
- Unaided visual examination of gels indicates only the positions of the loading dyes and not the positions of the DNA fragments. DNA fragments are visualized by staining the gel with a blue dye. The blue dye molecules have a high affinity for the DNA and strongly bind to the DNA fragments, which makes them visible. These visible bands of DNA may then be traced, photographed, sketched, or retained as a permanently dried gel for analysis.
Exercise 3: Analyzing the DNA Patterns in DNA Fingerprinting
Exercise 3 is a continuation of Exercise 2.
- Pour off the Bio-Safe DNA stain into a bottle or another appropriate container and destain the gel with 60 ml of water for ~15 minutes.
- Pour the water out of the staining tray. Follow your laboratory instruction regarding proper disposal of the stain.
- Trim away any empty lanes of the gel with a knife or razorblade. Let the gel dry on the hydrophilic side of a piece of gel support film or in your staining tray on your lab bench for 3–5 days. When the gel is dry, continue with the Quantitative Analysis of DNA Fragment Sizes
- The laboarory activity will provide more accurate measurements. In order to make the most accurate comparison between the crime scene DNA and the suspect DNA, other than just a visual match, a quantitative measurement of the fragment sizes needs to be created. This is done below:
-
- Using the ruler, measure the migration distance of each band. Measure the distance in millimeters from the bottom of the loading well to the center of each DNA band and record your numbers in a table. The data in the table will be used to construct a standard curve and to estimate the sizes of the crime scene and suspect restriction fragments.
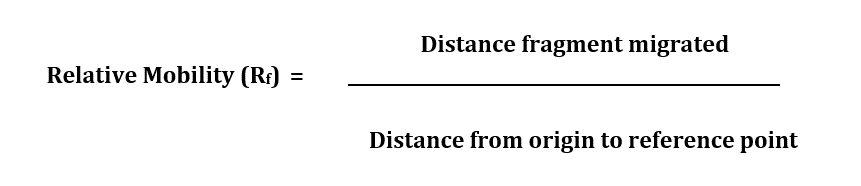
Determining Relative Mobility (Rf) in DNA Electrophoresis - To make an accurate estimate of the fragment sizes for either the crime scene or the suspects, a standard curve is created using the distance (x-axis) and fragment size (y-axis) data from the Lambda/HindIII size marker. Using both linear and semi-log graph paper, plot distance versus size for bands 2–6. On each graph, use a ruler and draw a line joining the points. Extend the line all the way to the right hand edge of the graph.
- Now check the graph that provides the straightest line that you could use to estimate the crime scene or the suspects’ fragment sizes.
- To estimate the size of an unknown crime scene or suspect fragment, find the distance that fragment traveled. Locate that distance on the x-axis of your standard graph. From that position on the x-axis, read up to the standard line, and then follow the graph line to over to the y-axis. You might want to draw a light pencil mark from the x-axis up to the standard curve and over to the y-axis showing what you’ve done.
- Where the graph line meets the y-axis, this is the approximate size of your unknown DNA fragment. Do this for all crime scene and suspect fragments.
- Compare the fragment sizes of the suspects and the crime scene.
-
DATA ANALYSIS & CRITICAL THINKING QUESTIONS
*Be sure to appropriately cite your sources*
- Name three other restriction enzymes and determine the palindrome for the cutting of the DNA
- What are the two factors that separate DNA fragment in gel electrophoresis?
- What are some of the factors that affect electrophoretic mobility and the resolution of the gel?
- What are the components of the TAE buffer?
- What is the purpose of loading dye?
- Why is it necessary to vary the agarose concentration according to fragment size of the molecules we are separating? What type of concentration (higher/lower) is most appropriate for larger fragments? For smaller ones?
- Which suspect is the culprit? How do you know?
- Include an image of your gel results in your report.
Licenses and Attributions
Biology I Cellular Processes Laboratory Manual by The authors & Hillsborough Community College is licensed under a Creative Commons Attribution-NonCommercial 4.0 International License.
Illustrations in this chapter have been adopted from
- National Human Genome Resreach Institute
- Cold Spring Harbor Laboratory DNA Learning Center
- DI Felice F, Micheli G, Camilloni G. Restriction enzymes and their use in molecular biology: An overview. J Biosci. 2019 Jun;44(2):38. PMID: 31180051.
- This lab is adopted from the Bio-Rad Forensic DNA Fingerprinting Kit
Restriction fragment length polymorphism (abbreviated RFLP) refers to differences (or variations) among people in their DNA sequences at sites recognized by restriction enzymes. Such variation results in different sized (or length) DNA fragments produced by digesting the DNA with a restriction enzyme. RFLPs can be used as genetic markers, which are often used to follow the inheritance of DNA through families.
The 3-dimensional structure of restriction enzymes allows them to attach themselves to a double-stranded DNA molecule and slide along the helix until they recognize a specific sequence of base pairs which signals the enzyme to stop sliding. The enzymes then digest (chemically separate) the DNA molecule at that site—called a "restriction site"—acting like molecular scissors, they cut DNA at a specific sequence of base pairs.
If a specific restriction site occurs in more than one location on a DNA molecule, a restriction enzyme will make a cut at each of those sites resulting in multiple fragments. The length of each fragment will depend upon the location of restriction sites contained within the DNA
molecule.
When restriction enzymes are used to cut a long strand of DNA, fragments of varying sizes may be produced. The fragments can be separated and visualized using a process known as agarose gel electrophoresis. The term electrophoresis means to carry with electricity.
A palindrome in DNA is a sequence consisting of two identical or highly similar inverted repeats which are either adjacent to one another or separated by a spacer region.
Agarose gel electrophoresis is commonly used to separate DNA fragments following restriction endonuclease digestion or PCR amplification. Fragments are detected by staining the gel with the intercalating dye, ethidium bromide, followed by visualization/photography under ultraviolet light.
A DNA marker (also known as a size standard or a DNA ladder) is loaded into the first well of the gel. The fragments in the marker are of a known length so can be used to help approximate the size of the fragments in the samples.
