
Chapter 6 Big Data, Business Intelligence and Analytics
Opening Vignette
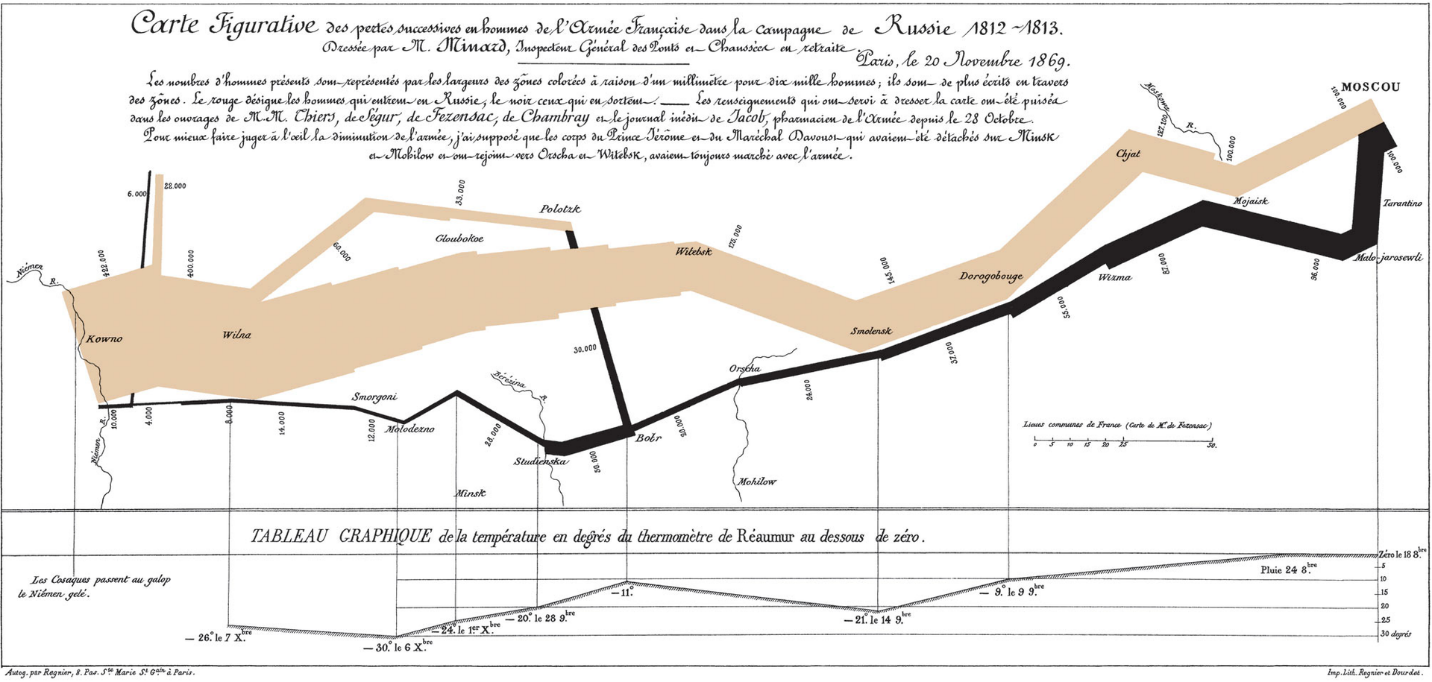
Napoleon’s invasion of Russia in 1812, also known as the Russian Campaign or the Patriotic War of 1812, was driven by a combination of geopolitical, economic, strategic, and personal motives. France’s reasons behind the campaign included Napoleon’s desire to enforce the Continental System which, by modern standards, is a form of sanctions aimed at weakening Britain by prohibiting trade between the British Empire and continental Europe.
Tsar Alexander I of Russia had initially agreed to the Continental System in the Treaty of Tilsit (1807). However, Russia’s economy suffered from the trade restrictions, leading Alexander to withdraw from the system in 1810. Napoleon sought to force Russia back into compliance with the Continental System to maintain the economic blockade against Britain, which he considered France’s greatest rival. Napoleon decides to invade Russia.
Napolean invaded Russia. He amassed “The Grand Armée” of more than 400,000 men that started the march on June 24,1812 and moved on foot for more than 1000 miles from their starting point near the Niemen River (in present-day Poland/Lithuania) towards Moscow. Napolean’s Grand Army fought many battles along the way, mainly the battles of Smolensk (August 16–18, 1812) and the battle of Borodino (September 7, 1812) to finally arrive at a burned-out and deserted Moscow. With no one to fight with, to surrender, or to negotiate peace. Facing starvation he decided to retreat.
During the retreat, the Napoleon’s army traveled the same distance back, but under far worse conditions, often taking longer and more indirect routes.
What does the chart depict
The illustration depicts Napoleon’s army departing the Polish-Russian border. A thick band illustrates the size of his army at specific geographic points during their advance and retreat. It displays six types of data in two dimensions: the number of Napoleon’s troops; the distance traveled; temperature; latitude and longitude; direction of travel; and location relative to specific dates (Time Scale).
Key Principle
The chart in figure 7-1 is considered by many as the earliest depiction of what we call today as Big Data (400,000 troops to account for; A supply chain flow that extended across thousands of physical locations; and a linear progress constrained by weather and topography). Truly a picture is worth more than a thousand words.
Most businesses operate on very thin margins and attempts at reducing cost is, in many instances, cutting into the proverbial bones. Competitiveness must be reimagined. New and modern methods that support the reimagination process goes far beyond doing “things” better, faster and cheaper. Could the promise of a crystal ball of Predictive Analytics prevented such a massive and catastrophic defeat of Napoleon? Perhaps.
Learning Objectives
Upon completion of this chapter, the student should be able to:
- Clearly explain the difference between Data and Information
- Define Big Data and explain why it is called Big
- Define the 7 characteristics of Big Data
- Explain the technologies that support uses of Big Data
- Explain how Businesses use Big Data as an Intelligence tool
- Explain the 2 basic types of Analytics descriptive and predictive
- Demonstrate knowledge of basic methods that support Descriptive Analytics
- Demonstrate knowledge the basic methods that support predictive analytics
- Explain Data Mining
Data, Information and Intelligence in Big Data

DATA – Bits and Bytes
Data is defined as a mere fact, devoid of any context or relative use. It is the smallest unit of recognition. A part of a number, a whole number, a part of a letter, a whole letter, a single word, and sometimes even an entire sentence that does not convey (inform) and on its own has very little usefulness. Within traditional computers, the smallest unit of Data is a representation of a bit. A bit is a single 0 (Zero) or a 1 (one). Zero’s and Ones in computers mean that electricity IS EITHER flowing inside the computer or it is NOT. Imagine a light bulb for instance, the wall switch controls the state of the bulb with Zero indicating the bulb is OFF, or a One, indicating the bulb is ON. Data is Binary. In contrast with the decimal system containing the set of digits {0 to 9}, binary refers to a numbering system that uses only two digits: 0 and 1. A combinations thereof, constitute a single alphabet (character), a symbol (such as equal sign, greater than, brackets, period, etc.) or perhaps a part of an image on your screen. Imagine if a pixel on your screen is missing (OFF), your image would then look as if you had a hole in it. In natural languages such as English, its words are composed of characters. Computer words are also composed of characters. A character in computers, however, is always the same number of bits and depends on the type, and version of an Operating System being used. In the Windows-based system (as of 2024) version 11, each character of the English language is represented by a unique set of 64 Zero’s and 1’s (bits).
As we go about our daily lives, we often hear the term Byte. A Byte is a part of a character, symbol or an image, except, by convention it is a composition of 8 bits.

Information
Information is a grouping of bytes of data that has context and is useful. Just as a book convey meaning (Context). Context develops when Data is grouped together in a grammatically correct manner (structured) and is processed (analyzed for value) and provides relevance.
Types of Data
Data have been organized by conventions. For example, the American Standard for Information Interchange (ASCII, pronounced asskee), is a standard that was developed in the early 1960’s to encode the English language character set into a language that computers can understand (i.e., zeros and Ones) and lists, in a table, the digital equivalent of the alphabet. Overtime, this coding standard expanded to include the various other types we know today. The two basic types of Data are:
Structured Types: Structured types of Data are sets that follow a standard size (each data element has the same number of Zero’s and Ones) and includes:
- Character Type: Assigns a unique string of O’s and 1’s, of same size, to each alphabet such as A (capital A), Vs. a (small case a)
- Numeric Type: that includes the decimal (o….9)
- Symbols Type: That includes all symbols found on a computer’s keyboard
- Special Symbols Type: That includes symbols for Math, Currency, Scientific and other uses
- Structured data fits neatly into a table and is easy to store and analyze by human and machines alike.
Unstructured Data Types (AIIM Blog, 2025): Unstructured Data Types are data elements that are not easy to store, understand or analyze by human or machines. This Data type does not follow a convention (standard size for example) and includes:
- Text documents: Any text file like Word documents, emails, blog posts, survey responses, where the information isn’t organized in a predefined structure.
- Images: Photographs, scanned documents, paintings – visual data without inherent organization
- Audio files: Music, voice recordings, podcasts – sound data that can’t be easily categorized with structured fields
- Video files: Movies, surveillance footage, recorded presentations – moving images with no predefined data structure
- Social media posts: Tweets, Facebook updates, Instagram captions – text-based interactions with varying formats and content
- Handwritten notes: Notes written on paper, where the information is not digitally structured
The “Big” in Big Data
How much is too much? and where is it all coming from? may be questions we ponder. As we go about our daily lives, we generate process and consume tremendous amounts of data. According to current estimates, humanity in the 21st century is producing more data in a single day than was ever produced in the entirety of human history up until the early 2000s, meaning the vast majority of data ever created is generated within the last couple of decades, with a significant portion created daily. To list but a few of the activities behind generating Data:
- Your teacher may ask you to write a 500-word paper on the topic of BIG Data. The average Word document with plain text (meaning no images, embedded HTML, or Videos, etc.) of single spaced, 500 English words document is around 65,000 bits. The average 500 words document with 3 images is around 1 million bits. An average textbook with 300 pages and 500 images is around 1.5 billion bits, or 187,500,000 Bytes.
- On average a person speaks approximately 30,000 words per day and a Princeton study calculated it to be around 40 million bits, or 5,000,000 Bytes.
- In the US, adults spend around 3 hours per day watching TV. All TV signals in the US have converted over to digital (i.e., bits) around 2010. Each hour of TV signals carries around 54 billion bits (in 4K HD), or 6,750,000,000 Bytes.
- On average Gen-Z interacts with the internet around 6 hrs. per day generating approximately 32 billion bits or around 4 Billion Bytes (Reviews.org, 2024).
- Just in the US, for calendar year 2022, general-purpose cards (Visa, Master Card, American Express, etc.) payments reached a record 153.3 billion transactions and $9.76 trillion in value. Note, these numbers didn’t account for Private Label card (merchant-branded), Electronic Benefits Cards, Debit Cards, Gift Cards, or any other payment means such as Government Purchasing cards.
Characteristics of Big Data
Big Data is a term that describes large sets of organized data that are so enormous in size and complexity that requires methods that go beyond the traditional Data Processing of hardware, software and analysis tools for understanding and management.
There are 7 key characteristics that describe Big Data:
1. Volume: are the amounts of data being generated, stored, and analyzed. 402 Million Terabytes are generated globally on daily basis. 90% of it is in just the last 2 years (2023 and 2024)
2. Velocity: Is the Speed at Which Data is Generated and Processed.
Velocity in the context of Big Data refers to the speed at which data is generated, collected, and processed. This characteristic is particularly important because the value of data often diminish rapidly if it is not processed and acted upon in real time or near-real time (Think of a stock price shown at the moment of opening / closing bell, or its constant movement throughout a trading day). Key aspects of Velocity include:
Real-time and Streaming Data: Many Big Data applications rely on real-time data processing. Examples include social media platforms, financial trading, and embedded IoT sensor devices. In these cases, data is generated continuously and often needs to be processed instantly to extract value (e.g., fraud detection, or live decisions to buy/sell recommendations).
High-frequency Data: Certain systems, like stock markets, sensor networks, or GPS-enabled devices, generate high-frequency data that needs to be analyzed almost as soon as it’s created. These applications often require specialized technologies like stream processing to handle large volumes of rapidly flowing data.
Timeliness and Latency: Low latency (the delay between data generation and processing) is critical in situations such as autonomous vehicles, online gaming, or emergency response systems, where decisions need to be made instantly. The need for processing speed can impact how the infrastructure and algorithms are designed.
Data at Scale: Not only does velocity deal with fast data generation, but also with the sheer scale at which it arrives. Consider the enormous amount of data produced by devices like smartphones, wearable health trackers, social media platforms, Home surveillance cameras, and Alexa and Siri-like devices, which all need to be processed continuously. Examples of Velocity in action includes:
Transactional Data on eCommerce websites: Recommendation systems generate real-time suggestions that are based on a user’s browsing and purchasing behavior, requiring fast data processing.
Stock Markets: Financial institutions analyze stock tickers and market data in real time to make split-second decisions.
Social Media: Data is continuously generated by billions of users posting updates, comments, likes & shares, and multimedia content. This data is processed quickly to serve included advertisements or to identify trending topics.
3. Variety.
Variety refers to the different types and formats of data that need to be processed and integrated in Big Data applications. In traditional databases, data is typically structured and stored in a tabular format (e.g., rows and columns), but Big Data often comes in diverse forms, such as text, images, videos, and sensor data. Key aspects of Variety include:
Structured Data: This is highly organized data that is easily searchable in databases (e.g., customer names, addresses, transaction records). While structured data remains important, it makes up only a small fraction of the data being generated today.
Semi-structured Data: Data that doesn’t fit neatly into a table but still contains some structure, often through hash tags or markers. Examples include XML and JSON files used for inter-website communication. Semi-structured data is increasingly common as companies integrate data from multiple sources.
Unstructured Data: This is data without a predefined structure, making it more difficult to store and analyze. Unstructured data includes text files, emails, social media posts, video and audio files, images, and documents. A significant portion of Big Data is unstructured, and new tools are being developed to extract value from this type of data.
Multimedia Data: This includes images, video, and audio, which require advanced technologies and processing like image recognition, facial recognition, speech-to-text, or video processing for analysis. For example, security systems might process video footage in real time to identify threats.
Sensor Data (IoT Data): The Internet of Things (IoT) is generating vast amounts of data from connected devices (smartphones, smart home devices, wearables, etc.), which can be structured (e.g., sensor readings) or unstructured (e.g., sound or image data).
Machine-Generated Data: This data is produced by machines and systems automatically, without human intervention. Examples include logs, transaction data, or sensor data from industrial equipment. This data often needs to be integrated with other types of data for meaningful analysis.
Metadata: Data about the data, such as when and where it was created, who created it, and how it is related to other data. Metadata helps organize and interpret the content of various data formats. Examples of Variety in action include:
Social Media Platforms: A platform like Meta (Facebook) or X (Twitter) has to process various forms of data, including text posts, images, videos, comments, and reactions.
Healthcare Industry: Healthcare data includes structured patient records (e.g., diagnosis, treatment) and unstructured data (e.g., doctor’s notes, radiology images, medical scans).
Self-Driving Cars: These vehicles generate a combination of structured data (e.g., GPS data, speed, and temperature) and unstructured data (e.g., video from cameras).
4. Veracity
Veracity is defined as The Trustworthiness and Quality of Data. It refers to the uncertainty or reliability of the data. In the world of Big Data, not all data is clean, accurate, or reliable. Inaccurate, incomplete, or inconsistent data can lead to poor insights and flawed decision-making. An examples of Veracity would be Social Media posts, tweets, and streamed News Media, that may be inaccurate, biased, and in some instances misleading and “manufactured”. Ensuring data veracity involves fact-checking and determining the credibility of the source. Other examples of the necessity for Veracity could appear in:
- Medical or Scientific experiments
- Voting Systems
- Electronic Health Records
- Financial Transactions
- Student Records
5. Value
Value is defined as The Utility and Insight of Data. Value is about extracting useful insights from Big Data and is truly transformative across various industries. By leveraging data analytics, organizations in retail, healthcare, finance, manufacturing, agriculture, transportation, telecommunications, energy, and education can optimize operations, enhance customer experiences, reduce costs, and make more informed decisions. Value answers questions like:
- Who is my best customer?
- What is the price my customers would be willing to pay for item X?
- What is today’s best delivery route for my truck drivers?
- Which optimal treatment should I follow to treat type X cancer patients?
- Which curriculum should I develop to optimize student success?
- And a million other like questions……
As important as the other characteristics of Big Data are, Value is by far front and center of the topic of Big Data Analytics.
6. Variability: The Changing Nature of Data.
Variability refers to the inconsistent or dynamic nature of data. Unlike structured data, which is relatively stable and predictable, Big Data can be highly variable. The data patterns, formats, and sources may change over time, requiring systems to adjust accordingly. Data Variability affects every known sector of the economy. Few examples of Data Variability include:
Healthcare – A patient’s record at a Physician’s practice may have to connect to a Hospital’s Electronic Records System made by different software company.
Utilities and Power Generation – Solar energy production is highly unpredictable because of conditions such as weather, wind and changes of the sun’s location throughout the day. The same fluctuations also impact energy consumption.
Agriculture – Seasonal change, Rain Forecasts, Weather Conditions, Soil Conditions and a host of other variables impact decisions of what to grow, when to grow, when harvest, and where and to whom to sell farm products.
Manufacturing – Sourcing of raw materials and changing supply chains, Inventory of raw and finished goods, forecasting demand, labor allocation, and a host of other related variables.
Financial Services – In finance, data variability is often encountered due to fluctuating market conditions, changing customer behaviors, and inconsistencies in data sources. Examples of variability are prevalent in Stock Market Data, Customer Transaction history, and financial regulations and reporting.
7. Visualization
Visualization is defined as the representation of an object, situation, or set of information as a chart or other image.
Visualization focuses on presenting Big Data in a way that makes it easier to understand and act upon (see Napoleon’s Russia Campaign). Given the vast amount of data and complexity involved, effective visualization helps stakeholders make sense of patterns, trends, and insights that enable accurate prediction of outcomes.
Analytical Tools and Technologies
As we have previously defined, Big Data are enormous sets of complex data sets that traditional data management methods of software, hardware and analysis processes are powerless in dealing with them. Facing that reality, technology development have answered this challenge and what emerged are truly amazing, simple and easy to use tools. In this section we will explore some of these transformative technologies.
Data Warehouse, Data Marts and Data Lakes

Data in its unprocessed form is known as raw data. Making sound business decisions on raw data is highly inaccurate. Data has to be “pre-processed”, cleaned and filtered, and organized in such a manner to facilitate easy access, retrieval and follow-on processing. Traditionally, this is what was termed as a Transaction Processing System (TPS). TPS captures the data from its source through daily execution of normal activities. In a Merchant’s system, starting at the cash register, the cash register collects transaction data (receipt of every item sold, retuned, or exchanged) by a customer. The merchant’s back-end system will pre-process this data, ensuring its accuracy, and time stamp every receipt then forward these receipts to the perspective payment processor who in turn validates accuracy, availability of funds and performs a settlement (withdraw money from Buyer’s bank and deposit the required amounts into merchant’s bank account).
As also mentioned earlier, buy/sell transactions are small data that can be very quickly processed. However, for super large merchants, transactions are not limited to just buy/sell. The merchant may have a huge supply chain, 10’s of thousands of physical locations, thousands of suppliers, and millions of customers interacting on daily basis, coupled with their urgent need to continue to be competitive and profitable.
A data warehouse is a centralized database (a software-based storage mechanism of data) that holds structured data in the form of records of transactions from many sources (Inmon, 1988). Customers, Suppliers, Banks, Government, payment processors, Gateway providers, Automated Clearing Houses, Products, Prices, Marketing Materials, and thousands of other pieces of information necessary to “manage” the business. A key purpose of a data warehouse is to provide a facility for querying (asking) the data to reveal specific information. (e.g., who is my best customer?). Key characteristics of a Data Warehouse include:
Data is Subject-Oriented: Data in a warehouse is organized around key business subjects such as sales data, finance data, customer data, supplier data, product data, etc.
Data is Integrated: The Data Warehouse consolidates data from various disparate sources (e.g., operational databases, flat files, cloud sources data, marketing & sales data, etc.), ensuring consistency in formats, units of measurement, and coding systems.
Data for Time-Variance: The Data Warehouse stores historical data, allowing organizations to analyze trends and performance over different periods, often spanning months or years (e.g., how do 4th quarter sales of this year compare to last year’s?)
Data is Non-Volatile: Once data is entered into the warehouse, it is rarely changed or deleted, ensuring a stable and consistent historical record.
Organization of a Data Warehouse
The organization of a data warehouse involves several layers that facilitate the flow of data from operational systems to analytical systems. These layers are crucial for structuring the data warehouse in a way that optimizes both storage and querying capabilities.
Data Sources– Data warehouses typically draw data from a variety of internal and external sources, including operational databases (e.g., sales or inventory systems), customer data, external market data, and sensor data. These sources are often heterogeneous, meaning they are in different formats and may be stored in different locations.
ETL Process (Extract, Transform, and Load)– The ETL process is the core of data integration in a data warehouse. It involves:
Extracting data from various sources.
Transforming the data into a consistent format (e.g., converting data types, cleaning data, standardizing measurements).
Loading the transformed data into the data warehouse, typically into fact tables (which contain quantitative data) and dimension tables (which contain descriptive attributes).
Data Warehouse Schema: Once the data is loaded, it is typically organized into schemas (designs) that define how data is stored and accessed:
Star Schema: The most common schema in data warehouses. It consists of a central fact table (storing numerical data, such as sales or revenue) and surrounding dimension tables (storing descriptive data, such as customer or product information)(Oxford English Dictionary, 2025).
Snowflake Schema: A more normalized version of the star schema, where dimension tables are further divided into additional tables to reduce data redundancy.
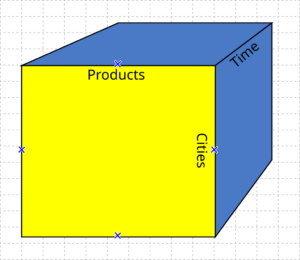
OLAP (Online Analytical Processing) – Data Warehouses are designed for OLAP, which involves multidimensional analysis. OLAP cubes allow users to view and analyze data from different perspectives (e.g., time, geography, product categories, etc). This enables fast querying and analysis of large datasets.
Data Warehouse and Decision Support
The primary purpose of a data warehouse is to support decision-making processes by providing a consolidated, reliable source of historical data. Data warehouses help businesses by:
a) Data Consolidation and Integration
A data warehouse enables businesses to consolidate data from multiple systems, ensuring that all relevant data is available in one place for analysis. This integration helps organizations break down silos and gain a comprehensive view of their operations.
b) Historical Analysis
By storing large volumes of historical data, a data warehouse provides businesses with the ability to perform trend analysis, forecast future performance, and monitor changes over time. This capability is critical for long-term strategic planning and decision-making.
c) Performance and Efficiency
Since data warehouses are optimized for analytical queries, they allow for faster and more efficient reporting and data retrieval compared to operational databases. This reduces the burden on transactional systems, improving their performance.
d) Quality and Consistency
The ETL process ensures that the data stored in a data warehouse is clean, standardized, and consistent. This improves the quality of data analysis and ensures that decision-makers are working with reliable information.
The Role of Data Warehouse in Business Intelligence (BI)
Data Warehouses play a central role in Business Intelligence (BI), which refers to the process of using data analysis tools and techniques to make informed business decisions. BI involves analyzing past performance to predict future outcomes, identify trends, and gain actionable insights. Data warehouses uses in BI include:
- Reporting and Dashboards – Data warehouses support the creation of reports and dashboards that summarize business performance. Business analysts and decision-makers can generate reports from the warehouse, providing insights into key performance indicators (KPIs), sales trends, financial performance, and customer behavior.
- Ad-Hoc Analysis – BI tools allow users to perform ad-hoc analysis on data from the warehouse. This means that business users can create their own queries or reports based on specific needs without relying on IT teams. The flexible querying capabilities of data warehouses make this possible by enabling users to quickly generate insights from large datasets.
- Decision Support – Data Warehouses provide businesses with the ability to make data-driven decisions. Whether it’s analyzing sales data to optimize inventory, understanding customer behavior to improve marketing strategies, or evaluating financial performance to guide investment decisions, the insights derived from a data warehouse are used to drive strategic decisions at every level of the organization.
- Business Analytics – With the integration of advanced analytics tools, organizations can use data warehouses for more sophisticated analyses such as forecasting, trend analysis, and scenario modeling. By combining historical data stored in the warehouse with current data and predictive models, businesses can develop insights that guide future strategies.
- Data Mining – is an integral process of BI. It is the process of analyzing large datasets to uncover hidden patterns, correlations, trends, and relationships within the data. It combines aspects of statistics, machine learning, and artificial intelligence (AI) to extract meaningful information and predict future outcomes (Eye on Tech, 2021).
Key Characteristics of Data Mining
As a process, Data Mining is characterized by
- Pattern Discovery: Data mining helps identify patterns, which could be used to predict future behavior or trends.
- Classification and Clustering: It groups data into categories (classification) or finds natural groupings (clustering).
- Prediction: Using historical data to predict future events or behaviors.
- Association: It identifies associations and relationships between variables (e.g., market basket analysis).
- Anomaly Detection: It detects outliers or unusual patterns that might indicate fraud or other exceptional circumstances.
Categories of Business Intelligence and Analytics
There are several techniques used by Financial Technology companies to advance their penetration into the Fintech market. They include Descriptive Analytics, Predictive Analytics, Optimization, Simulation and Text, Image and Video Analysis.
|
Descriptive |
Predictive |
Optimization |
Simulation |
Text & Video Analysis |
|---|---|---|---|---|
|
Visual Analysis |
Time Series Analysis |
Genetic Algorithms |
Scenario Analysis |
Text Analysis |
|
Regression Analysis |
Data Mining |
Linear Programming |
Monte Carlo Simulations |
Video Analysis |
Descriptive Analytics
Descriptive Analytics – is an early, pre-processing of the Data. Its intent is to identify TRENDS, and PATTERNS in the data answering questions like who, what, where, when and why certain conditions or events occurred and as revealed by the analysis of the data. For example, a high volume of positive tweets about a certain company may lead to an increase in its stock price.
Descriptive Analytics uses simple tools such as Excel spreadsheets to organize, categorize, clean and prepare the data then run excel functions such as Pivot Tables, and What-If-Anaylsis. Data is typically presented in forms of graphs, charts and other graphics using Visualization tools such as Microsft’s PowerBI or Plateau amongst many others.
Visual Analysis – Presents results of the analysis in pictorial form (see Napoleon’s March). Other common use of Visualizing the data c0ontent is through what is know as a Word Count. Figure X-2 below shows a typical representation called Word Cloud.
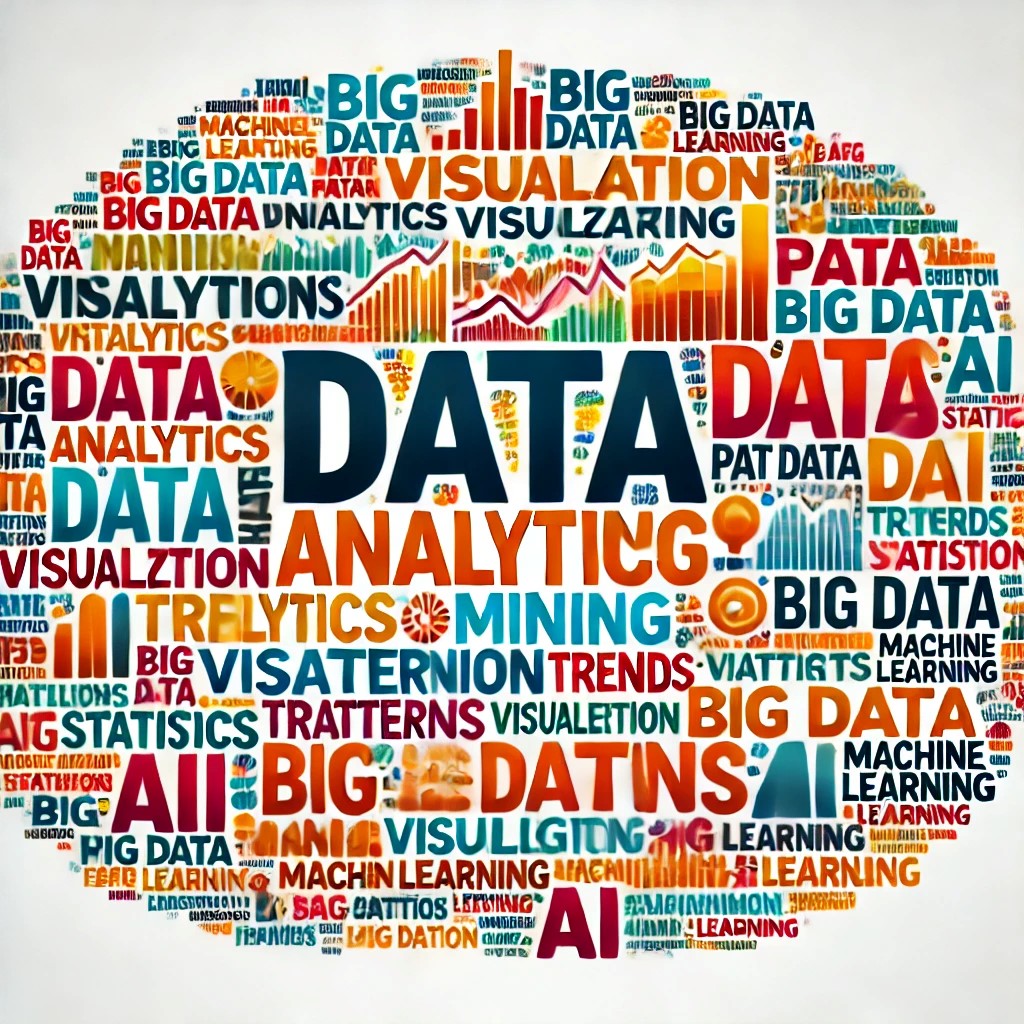
To illustrate the concept, this very chapter on Big Data and Analytics topic was used by Word Cloud analytics. Word Cloud analysis uses frequency of occurrence of an important word by size indicating preference. As we see in the above image, the word DATA is the primary theme due to its size. Other words of lessor importance appear in a much smaller font size. Fig- 7-11 Conversion Funnel for a typical eCommerce web site showing effectivity of the website in gaining new sales. Image generated by OpenAI’s DALL·E
Conversion Funnel – is an analysis tool used to show comparative statistics.
A visual representation below of a conversion funnel for a typical eCommerce website shows the stages and effectiveness in gaining new sales. In our example an eCommerce web site’s effectivity is in attracting potential customers, keeping their interest high and ultimately converting them into actual customers. The funnel, divided into five clearly labeled sections from top to bottom—’Visitors’, ‘Product Views’, ‘Add to Cart’, ‘Checkout Initiated’, and ‘Sales Completed’—demonstrates how an eCommerce site attracts potential customers, maintains their interest, and ultimately converts them into actual buyers. Each section becomes progressively narrower, symbolizing the drop-off rates at each stage, with corresponding percentages displayed to highlight this attrition. The clean, minimal background highlights the color-coded stages, each with icons like a shopping bag for ‘Add to Cart’ and a dollar sign for ‘Sales Completed’ to enhance clarity.

Regression Analysis – Regression analysis is a simple statistical computation of dependent Vs. Independent variables. Let’s suppose that the US government publishes a statistic on new home building starts that says “…Building new home starts in 2025 will exceed 2 Million new homes” and lets also presume you are a manufacturer of Door Handles. What does 2 million new home starts indicate to your business? This is where how many door handles should I make decision comes in. The Quantity of how many door handles should you make is dependent on how many new homes will be built (along with other variable numbers such as competition). What are your distribution channels? Will you be using Home Depot, Lowes, commercial building supply wholesalers, etc., as you can imagine, these variables could get pretty complex.
Using Excel it is pretty easy task to just plug all the variable numbers (dependents) against the independent variable (# of new housing starts) to generate a regression chart that would describe your analysis.
Predictive Analysis
Predictive Analysis – is a set of statistical tools that analyze data to predict a certain outcome and is primarily composed of 2 branches, mainly Data Mining and Time Series analysis. We covered data mining in detail in the previous discussion on Big Data. Inhere we will discuss the topic of Time Series Analysis.
Time Series Analysis – is a statistical tools used to examines data points collected over a period of time, allowing analysts to identify patterns, trends, and seasonal variations within the data by observing how values change over consistent time intervals, often used to forecast future values based on past data patterns.
An example of time series data is daily, time stamped measures of temperature, dew points, humidity, wind speed, rain fall, etc. over a period spanning the last 10 years. What patterns emerge when we crunch these numbers? What is the correlation between temperature and rainfall? etc.
Time series analysis can be used to predict patient arrival times at a hospital emergency room, ensuring adequate nursing staff are available, or answer the question of how many Fintech suppliers are available to run” buy transactions” at 3:00 AM and predict acceptance Vs. rejection of a transaction. Time series in this case performs forecasting (i.e., predicting the future outcome).
Optimization Analysis
Minimizing costs and maximizing profitability are cornerstone to every successful business enterprise. Management by data, rather than by intuition, is the subject of Optimization Analysis. What area of my business needs attention?, why are my labor costs much higher than industry benchmarks?, how do I improve my supply chain? and so many more questions can be answered by applying Optimization Analysis methods. One popular analysis method is called the Genetic Algorithm.
Genetic Algorithms – A reference to the English Naturalist Charles Darwin’s Theory of Evolution where he states: “All organisms rise and develop through natural evolution processes of small, inherited variations (Shannon, n.d.).
A genetic algorithm is a software-driven step-by-step process that replicates the inheritance properties in the data in order to find approximate solutions to optimization. Think of a married couple, one with brown eyes, the other has green eyes. What is the chance of having a baby with hazel colored eyes? At a mathematical average it should be 50% of the time.
A genetic algorithms works by taking a node (starting) population of data called chromosomes of individual solutions and through multiple simulations this population is gradually evolved, by an iterative process towards a better and better solution. Think again of playing chess and again with every new game, eliminating (not playing) prior moves when you said to yourself I should have not played that move, and selecting only those prior moves that resulted in a better outcome. For each generation (successive plays), your chances of winning the game improve.
Linear Programming
Linear programming is a simple algebraic method that uses linear equations to determine how to arrive at the optimal situation (maximum or minimum) as an answer to a mathematical problem(Shannon, 1948). (e.g., 2X+3=8).
Again, Excel simplifies solving for linear functions with one or more variables.
Simulations
In Florida, weather patterns are monitor by the US National Oceanic and Atmospheric Administration (NOAA), National Hurricane Center (NHC) that analyze satellite imagery, weather data and historical observations to generates computer models that make forecast decisions and create hazard information for emergency managers, media and the public for hurricanes, tropical storms and tropical depressions.
A computer simulation mimics the real world (virtual) and as such in Fintech, dynamic responses of a system. For example, take a transaction process starting at a point-of-sale, and all the intermediary steps of transaction aggregation, clearing, processing, and settlement ca be simulated to understand the behavior of the system. Simulation would answer questions like what would happen if we stress the system by having billions of transactions flow simultaneously. What would break? How and where would it break? and what are the net results of the break?
Financial Systems and Fintech systems simulations work using sophisticated statistical methods such as Monte Carlo analysis that “model” the different financial market conditions and potential outcomes by assigning random values to uncertain variables and running multiple iterations to calculate probabilities of various results; this is widely used in financial risk management, asset valuation, and portfolio allocation. An example use would be a financial planner helping a retiree with answering “how long will my retirement portfolio last”?
Again, as complex as it may sound, simple solutions (simulations) can be developed using Excel. Running multiple Monte Carlo simulation functions, one can determine answers like “in 100 runs of the simulations, only 20 runs indicated that this portfolio will last for more than 10 years”.
Text and Video Analytics
Text and Video Analytics are techniques used in evaluating textual, as well as video imagery to find hidden patterns in the data.
Textual Analytics– Is a process that extracts value from very large amount of textual data such as consumer reports, comments, complaints and product reviews. It also monitors social media postings to identify consumer sentiment and to recognize changes in consumer behavior.
Many companies in the US use free-form call center records to synthesize their support operations, marketing and pricing strategies, and new product development.
Video Analytics – is also a process that extracts deeper insights from video footage. Imagine the value, in addition to cost savings, while running a new product development marketing campaign, of having customers sample your latest perfume while you observe their facial expression after sampling the products you are market testing. Many transportation companies as for Trains, Busses and Planes, currently use video analytics to understand commuter behavior and to implement methods to ease congestion at terminals.
Data Marts
Data marts are specialized, smaller-scale repositories that store data custom-tailored to meet the needs of specific business units or functional areas within an organization, such as sales, marketing, or finance. Unlike comprehensive data warehouses, which aggregate data across an organization, data marts focus on particular domains, offering streamlined data analysis for targeted decision-making.
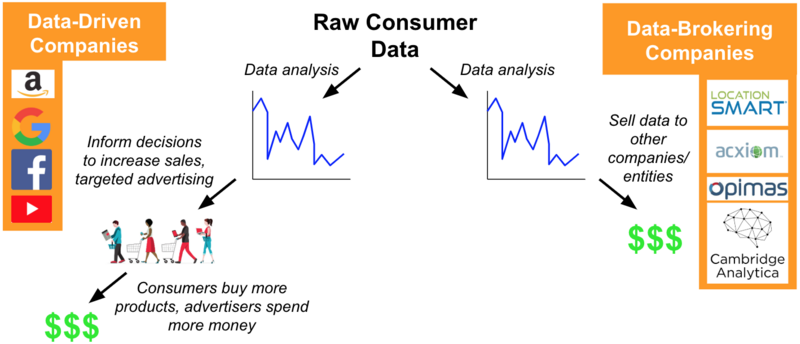
Data Marts extracts and organizes data from the central data warehouse (or external sources), optimizing it for easy access and faster queries. By categorizing Data, companies are often using this organized data to sell rather than use internally. A search on Google’s website for example reveals 100’s of companies known as Data Brokers” with names like Acxiom, Experian, CoreLogic, Google, Salesforce, and Signal AI that are considered to be among the companies that sell user data (your data and mine), often by collecting personal information from various sources and then selling it to other businesses in bulk for targeted marketing and other purposes (The Verge, 2025).
Data Lakes
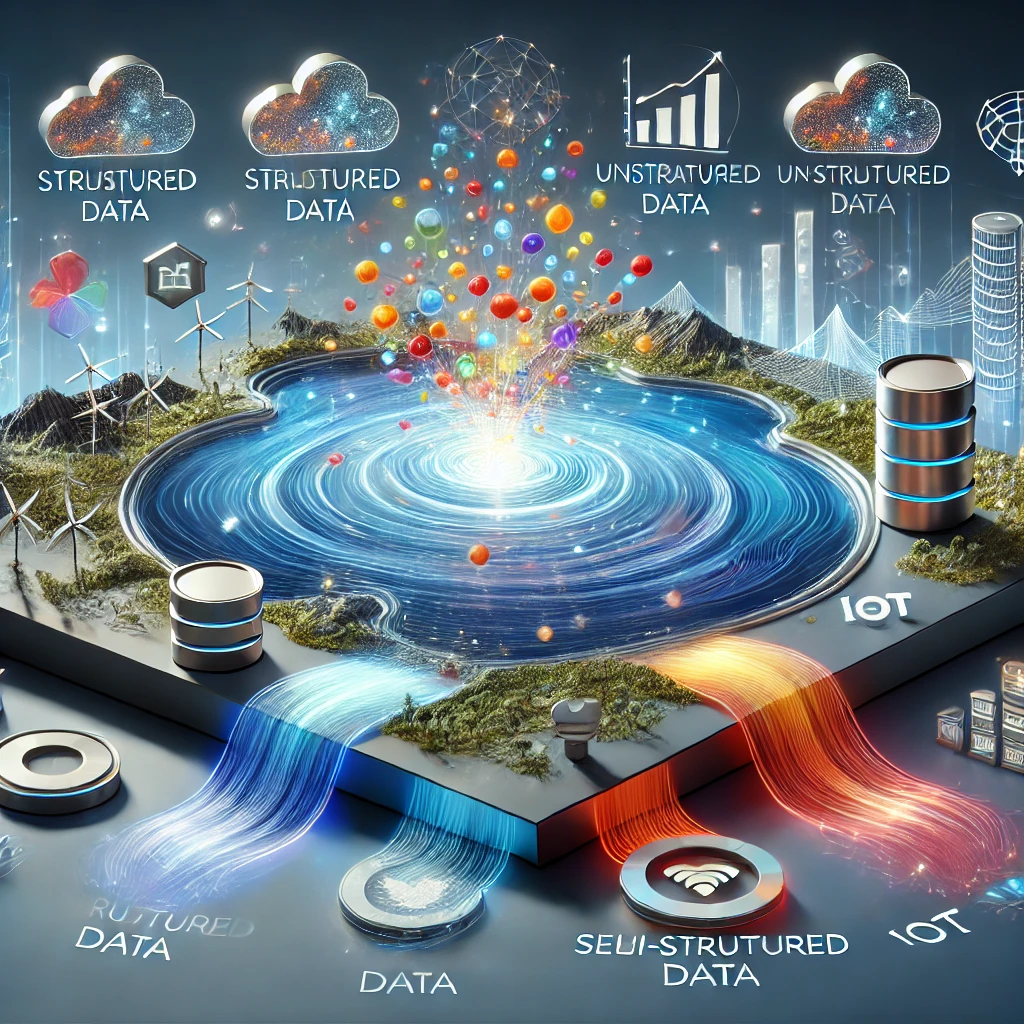
Structured data is quite easy for computers to process. The challenge with Big Data are unstructured data such as a streamed movie, and an hour of streamed music are just few on unstructured data sources. Unlike traditional data warehouses that store structured data in predefined schemas, data lakes allow for the storage of raw data regardless of format, size, or source. Hence the term Lake that has many streams pouring into it and many different species of aquatic life. This capability enables businesses to capture a wide range of data types and unlock new opportunities for advanced analytics and artificial intelligence.
Data lakes have certain key characteristics that include:
- Scalability – They can store enormous amounts of data often in multiples of Petabytes (1 petabyte = 1 followed by 15 zeros)
- Flexibility: Stores raw data in its original form.
- Diversity: Accommodates structured, semi-structured, and unstructured data.
- Accessibility: Provides seamless access for analytics, machine learning, and reporting.
|
Feature |
Data Lake |
Data Warehouse |
|---|---|---|
|
Data Type |
Structured. Semi-structured and unstructured |
Strictly structured |
|
Schema (model) |
Built and deployed during the Analysis phase when data is being read |
Pre-designed and focuses on Storing the data in a specific format and size |
|
Cost |
Storing the data is minimal |
Storing the data is comparatively high |
|
Used for |
Analytics, Aritificial Intelligence and Machine Learning |
Reporting and Business Intelligence |
|
Scalability |
Highly Scalable |
Limited by cost |
|
Data Type |
Structured, semi-structured, unstructured |
Structured |
|
Schema |
Schema-on-read |
Schema-on-write |
|
Cost |
Low-cost storage |
High-cost storage |
|
Purpose |
Analytics, AI, and ML |
Reporting and business intelligence |
|
Scalability |
Highly scalable |
Limited scalability |
Table 7-2 Comparative Analysis of Features of Data Lakes Vs. Data Warehouse
Data Lakes in Fintech
Data Lakes have become integral to financial technology (FinTech) companies due to their ability to manage and analyze vast, diverse, and rapidly growing datasets. FinTech businesses rely on data lakes to perform:
- Fraud Detection and Risk Management – Fraud detection requires sophisticated models that can process massive datasets to identify anomalies and patterns indicative of fraudulent activity. The ability of Data Lakes to handle varying data types is crucial, as fraud signals often come from diverse sources, such as emails, call logs, or social media.
- Anomaly Detection – Using machine learning algorithms trained on historical data to flag suspicious activities.
- Behavioral Analysis- Tracking spending patterns, device fingerprints, and geolocation data to identify unusual transactions.
- Risk Assessment– Combining external and internal data to calculate risk scores for transactions or user accounts.
- Regulatory Compliance and Auditing– Financial institutions face stringent regulations such as GDPR, CCPA, KYC, and anti-money laundering (AML) laws. Data lakes capabilities are foten called upon to perform data retention analysis, audit trails and to perform automated reporting.
- Personalization and Customer Insights– FinTech companies use data lakes to develop personalized services, such as providing Customized Financial Products, enabling real-time (Dynamic) Pricing Models for adjusting rates for loans, insurance, or investment products all based on real-time data.
- Algorithmic Trading – Algorithmic or automated trading (sometimes called Robo-trade); relies on analyzing vast amounts of market and historical data to make split-second decisions.
- Data Aggregation – Collecting market feeds, news articles, and historical price data in real-time.
- Back Testing Models – Using historical data stored in the lake to evaluate the effectiveness of trading algorithms.
- Market Sentiment Analysis – Incorporating alternative datasets, such as social media sentiment, to inform trading strategies.

Feedback/Errata